A scaffold load chart looks like a spreadsheet and reads like one: find your bay span, find your lift height, find your scaffold height, read the allowable leg load. Four lookups, one number, and that number tells you whether the layout you drew can stand up. Everything else on the page is the system's test evidence behind it.
The trouble is that the number is easy to misread — as a platform capacity, as a per-square-metre load, or as an interchangeable figure between brands. It is none of those. Here is how the table is built, how to read it, and the five things that quietly shrink it on site. The load side of the same chain — dead, live and wind — is in our load calculation basics.
What Is Actually in the Table
A ringlock load chart is a matrix of three geometry inputs against one output:
- Bay span (metres along the facade) — sets the ledger span, and therefore the platform's bending demand
- Lift height (metres between boarded levels) — sets the unbraced length of the standard between ledgers
- Scaffold height (metres, or number of lifts) — sets the accumulated load and the slenderness of the leg
The output is the allowable leg load in kN: the maximum design force one standard may deliver to its base jack, for that combination, with the system's partial and global safety factors already applied.
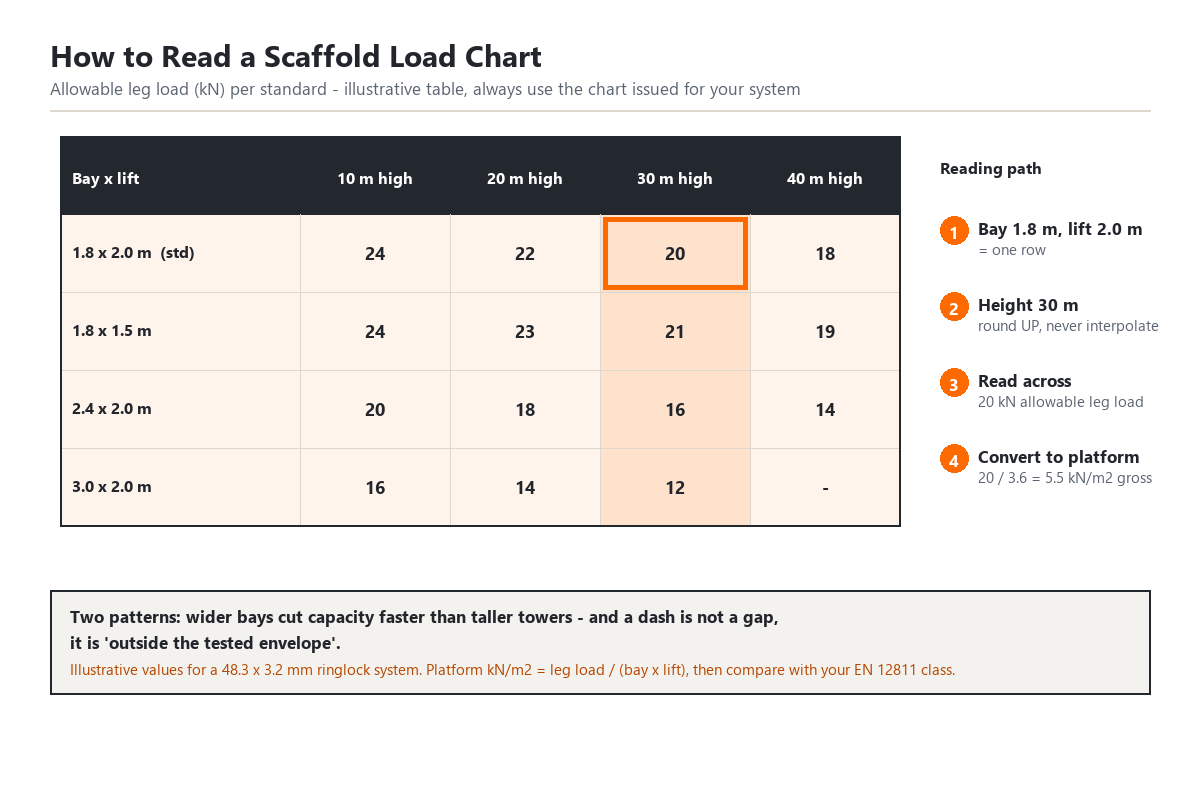
A representative chart for a 48.3 × 3.2 mm ringlock system looks like this. The structure is standard across the industry; the values are illustrative and must be replaced by the table issued for the exact system you buy:
| Bay span × lift | 10 m high | 20 m high | 30 m high | 40 m high |
|---|---|---|---|---|
| 1.8 × 2.0 m (export standard) | 24 kN | 22 kN | 20 kN | 18 kN |
| 1.8 × 1.5 m | 24 kN | 23 kN | 21 kN | 19 kN |
| 2.4 × 2.0 m | 20 kN | 18 kN | 16 kN | 14 kN |
| 3.0 × 2.0 m | 16 kN | 14 kN | 12 kN | — |
Two patterns matter more than any single cell. First, wider bays cut capacity faster than taller towers cut it — going from a 1.8 m to a 3.0 m bay at 10 m height costs you a third of the leg load, because ledger bending rises with the square of the span. Second, the dashes are not omissions: a cell with no value means the geometry is outside the tested envelope and cannot be used at all.
Reading It in Four Steps
Step 1 — Fix your geometry. Bay 1.8 m, lift 2.0 m. That is one row.
Step 2 — Find the height column that covers you. Not the height you are building today — the height the scaffold will reach, plus any tower or loading bay above it. Round up: a 22 m facade reads the 30 m column, never an interpolation between 20 and 30.
Step 3 — Read the allowable leg load. At 1.8 × 2.0 m, 30 m: 20 kN per leg.
Step 4 — Convert it to a platform load and compare. Each leg at this grid carries one bay × one lift of platform:
- Tributary area = 1.8 m × 2.0 m = 3.6 m²
- Gross platform capacity = 20 kN ÷ 3.6 m² = 5.5 kN/m²
- Less structure self-weight (≈ 0.2 kN/m² at this grid with every lift boarded) ≈ 5.3 kN/m²
That is above EN 12811 Class 5 (4.5 kN/m²), so the leg is not your limit here — the platform class, the plank rating and the ties will be. Conversely, at 3.0 m bays and 40 m height the leg load collapses to 10–12 kN, which works out at roughly 1.7 kN/m²: below Class 3. The same system that is generous on a tight grid becomes inadequate on a wide one. That is the whole reason the chart exists.
The geometry rules for the grid itself are in our ringlock size chart.
The Five Things That Shrink the Chart
| Factor | What it does | What to do |
|---|---|---|
| Height above the last tie | Capacity falls as the unbraced leg length grows | Add ties at the spacing the chart assumes — usually every 4 m vertically, 8 m horizontally |
| Bracing removed or altered | The chart assumes the tested brace pattern | Restore the pattern before loading; never "borrow" braces for another elevation |
| Eccentric or point loads | A concentrated stack loads one leg, not the bay | Spread material over the bay; keep loading bays designed, not improvised |
| Base condition | A leg on soft ground is not a leg on rock | Size sole boards as in our ground bearing guide |
| Mixed or worn components | Damaged, corroded or mismatched tube changes the section | Inspect and reject; a chart is only valid for the system it was tested on |
Two more that are not visible in the table but decide the outcome: wind, which drives tie and bracing demand rather than leg load, and pattern loading, which is why charts already assume not every lift is fully loaded at once. If your site loads three lifts with pallets, you are outside the chart's assumption even though the total looks fine.
What the Chart Does Not Tell You
Three limits worth stating plainly, because they are where quotations and site arguments go wrong:
- It is not a platform capacity. The chart caps the leg. The plank rating caps the deck. The platform class caps the working load. The lowest of the three governs the job.
- It is not transferable between systems. Ringlock from two suppliers with the same tube diameter can carry different allowable loads, because rosette spacing, wedge geometry and test reports differ. Ask for the table that belongs to the batch you are buying.
- It is not a substitute for design. For anything above routine facade access — loading towers, shoring, cantilevers, anything with a public interface — the layout still needs an engineer's check against wind, ties and foundations.
When we quote a ringlock package we send the load table for the exact system alongside the take-off, and we flag the assumptions (bay grid, lift height, tie spacing) so your engineer can verify them in one pass. Our ringlock system is supplied hot-dip galvanized inside and out to EN ISO 1461 with the full component set that the tested bracing pattern requires.
Send us your facade dimensions and the loads you intend to apply, and we will return the grid, the tonnage and the applicable load table together — request a scheme →.
Frequently Asked Questions
How do you read a scaffold load chart?
Four steps: find the row for your bay span and lift height, follow the column for your scaffold height, read the allowable leg load in kN, then divide by the leg's tributary platform area to compare against your required platform class. Never interpolate between rows — use the next heavier row.
What does the allowable leg load mean?
It is the maximum design load one standard can carry at its base for that geometry and height, with the system's safety factors already built in. It is a ceiling for the leg — not the platform's capacity, which the platform class and the planks also govern.
What is a typical allowable load per ringlock leg?
For standard ringlock at a 1.8 m bay and 2.0 m lift, published tables for comparable systems commonly show about 24 kN per leg at low heights, falling as the tower rises. Always use the table issued for the exact system you are buying.
Why does the allowable load drop as the scaffold gets taller?
Because the standard is a slender column: the higher the leg runs unbraced between ties and ledgers, the more its capacity reduces. Height, tie spacing and bracing pattern are why a chart has columns, not a single number.
Can I exceed the chart if I use more planks or a stronger tube?
No. The chart belongs to the tested system; changing components voids it. If your loads exceed the table, the answer is a denser bay grid, more ties, or a designed shoring system — not a stronger plank.