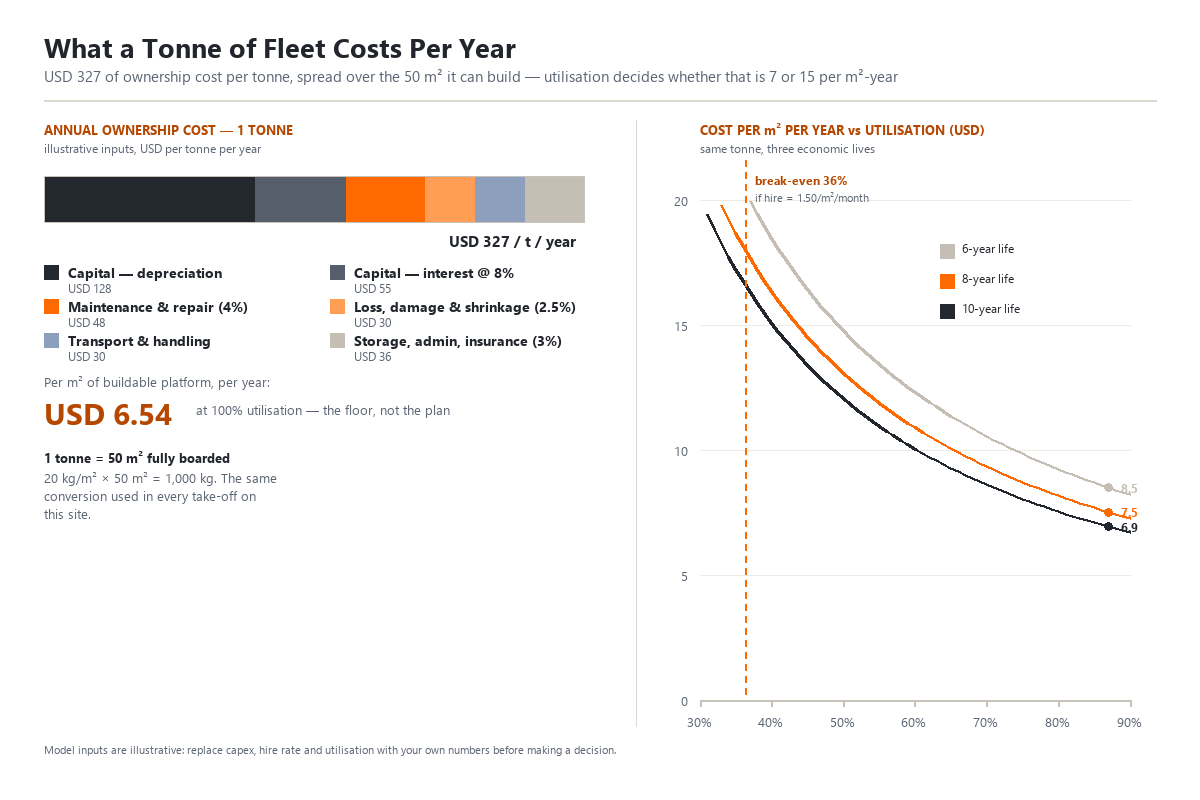
Two numbers get confused in every scaffolding investment conversation. Price per tonne is what you pay once, at the border, on the proforma invoice. Cost per square metre per year is what the fleet actually costs you while it earns — and it is the only number that decides whether a rental fleet, or a bought stock for a contractor's own jobs, makes money. Run the standard model — an 8-year life, a 65% utilisation rate, and the 50 m² per tonne that a fully boarded ringlock tonne builds — and the answer lands at roughly USD 10 per square metre per year, or about 0.84 per m² per month, before profit.
The spread around that headline is enormous, and it is not driven by the purchase price. It is driven by two variables the invoice never shows: how many years the zinc keeps the steel alive, and what share of the year the equipment is actually on hire. This article gives you the six-line cost model, the sensitivity tables, and the break-even test — so you can replace the illustrative inputs with your own and get your own number.
The Formula, in One Line
Cost per m² per year = annual ownership cost per tonne ÷ (50 m² × utilisation)
Both halves come from elsewhere on this site. The 50 m² is the conversion anchor — 20 kg of steel per square metre of fully boarded facade — derived component-by-component in our square metres per tonne guide. Utilisation is your own operating number: the share of the year the equipment is out on hire (or on your own sites, working). Everything else in the model exists to fill the numerator.
The Six Lines of Annual Ownership Cost
All figures below are illustrative modelling inputs, not quotations — replace each with your own invoice and your own market before acting. The capex figure sits inside the indicative range published in our ringlock price article; nothing here is an offer.
| Line | Basis (illustrative) | USD / t / year |
|---|---|---|
| Capital — depreciation | (1,200 capex − 180 residual) ÷ 8 years | 128 |
| Capital — interest | 8% on average book value (690) | 55 |
| Maintenance & repair | 4% of capex — wedge pins, plank repairs, straightening, zinc touch-up | 48 |
| Loss, damage & shrinkage | 2.5% of capex — the rental trade's quiet tax | 30 |
| Transport & handling | 2.5 round-trip movements × 12 per movement | 30 |
| Storage, inspection, admin, insurance | 3% of capex | 36 |
| Total | 327 |
Three assumptions deserve scrutiny, because each one moves the total more than any negotiation on the capex line.
The economic life. Eight years is a planning basis, not a law — and it is a galvanizing question, not a steel one. Coated inside and out to EN ISO 1461 (mean ≥ 70 µm on 3.2 mm tube), a fleet's steel outlasts its coating; the coating is the consumable. Our EN ISO 1461 breakdown explains why 70 µm mean is the figure to write into the purchase order and why "galvanized" without a standard is not a specification.
The residual value. 15% of capex (180 on 1,200) assumes scrap-value recovery at end of life. Hot-dip galvanized steel retains real scrap value because the zinc does not contaminate the melt — a painted fleet does not enjoy the same exit.
What scales and what does not. Maintenance, damage and transport partly scale with utilisation — a fleet working harder gets hit more. This model keeps them flat, which makes the per-m² figure slightly optimistic at very high utilisation and slightly conservative at low utilisation. The shape of the conclusion survives either way.
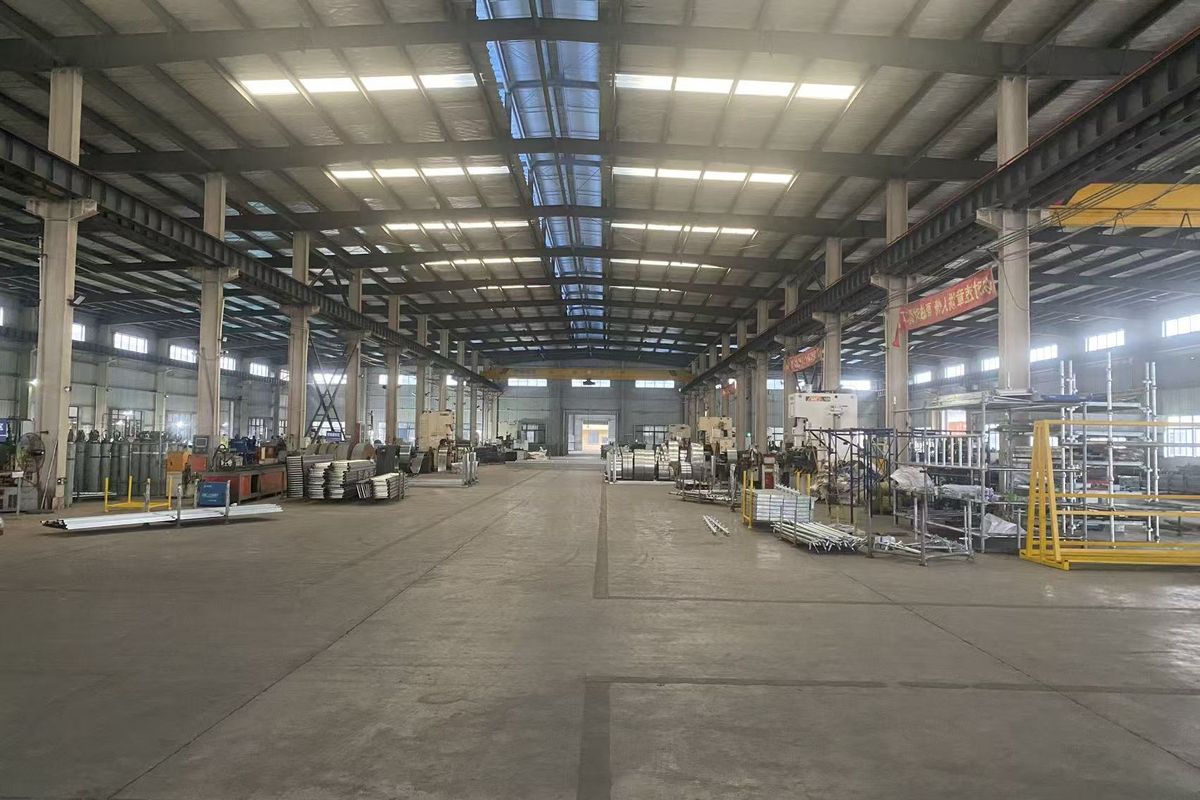
Storage is the line that never appears on a purchase invoice yet recurs every month of the fleet's life. Banded, racked and waiting for the next mobilisation, stored equipment is capital accruing cost with no hire revenue against it — which is why yard economics belong in the same model as the border invoice.
From Tonnes to Square Metres
The denominator starts with the anchor: 1 tonne ≈ 50 m² of fully boarded facade at the export-standard grid (1.8 m bays, 2.0 m lifts, double row). That gives the floor:
327 ÷ 50 = USD 6.54 per m² per year at 100% utilisation — the best case, and the one no fleet achieves.
If you are still sizing the fleet itself, the take-off formula in our quantity calculation guide converts a facade into the component list, and the container loading guide converts the list into shipment units. Fleet planning and shipment planning use the same arithmetic from opposite ends.
Utilisation Decides Everything
Divide the same 6.54 by whatever share of the year the equipment actually works, and the number moves almost threefold across a realistic operating range:
| Utilisation | 6-year life | 8-year life | 10-year life |
|---|---|---|---|
| 45% | 16.41 | 14.52 | 13.39 |
| 55% | 13.43 | 11.88 | 10.95 |
| 65% | 11.36 | 10.05 | 9.27 |
| 75% | 9.85 | 8.71 | 8.03 |
| 85% | 8.69 | 7.69 | 7.09 |
Read the table the way an operator would. Moving utilisation from 55% to 75% on an 8-year life cuts cost per m²-year by 27% — a bigger swing than any achievable discount on the purchase invoice. Buying two extra years of life (10 instead of 8) is worth about 8% at every utilisation level. The two levers compound: the best cell in the table is less than half the worst.
Every tonne standing in the yard is the fixed cost accruing with nothing to invoice against it. That is why fleet mix matters as much as sales: own the fast-moving standard-grid components that turn every week, and hire in the odd sizes that sit. A yard full of slow-moving stock is the utilisation problem made visible.
Break-Even Against the Hire Rate
The last test turns the model into a decision. If you can charge H per m² per month in your market, the fleet breaks even at:
**Utilisation\ = (annual cost per m²) ÷ (12 × H)*
At an example rate of 1.50 per m² per month on an 8-year life: 6.54 ÷ 18 = 36%. Below that utilisation the fleet loses money however efficiently the yard runs; above it, every point of utilisation is margin. The rate is yours to set — the formula is the point. Three checks worth running before you commit capital:
- At your real hire rate, not an aspirational one. A 20% lower rate pushes break-even utilisation up by roughly a quarter.
- At your real life, not the brochure's. Coastal atmospheres and rough handling both shorten the denominator's leverage.
- Against the alternative. If you can hire the same grid in-market for less than your ownership cost per m²-month plus your own admin, the answer is hire-in — see the cross-check below.
What the Model Ignores
- Costs that scale with work. Maintenance, damage and transport rise with hire cycles; at very high utilisation the curve flattens upward, not downward.
- Atmosphere. A fleet working on a coastal petrochemical site ages faster than the same steel in an inland market. The galvanizing article gives the service-life ranges by environment.
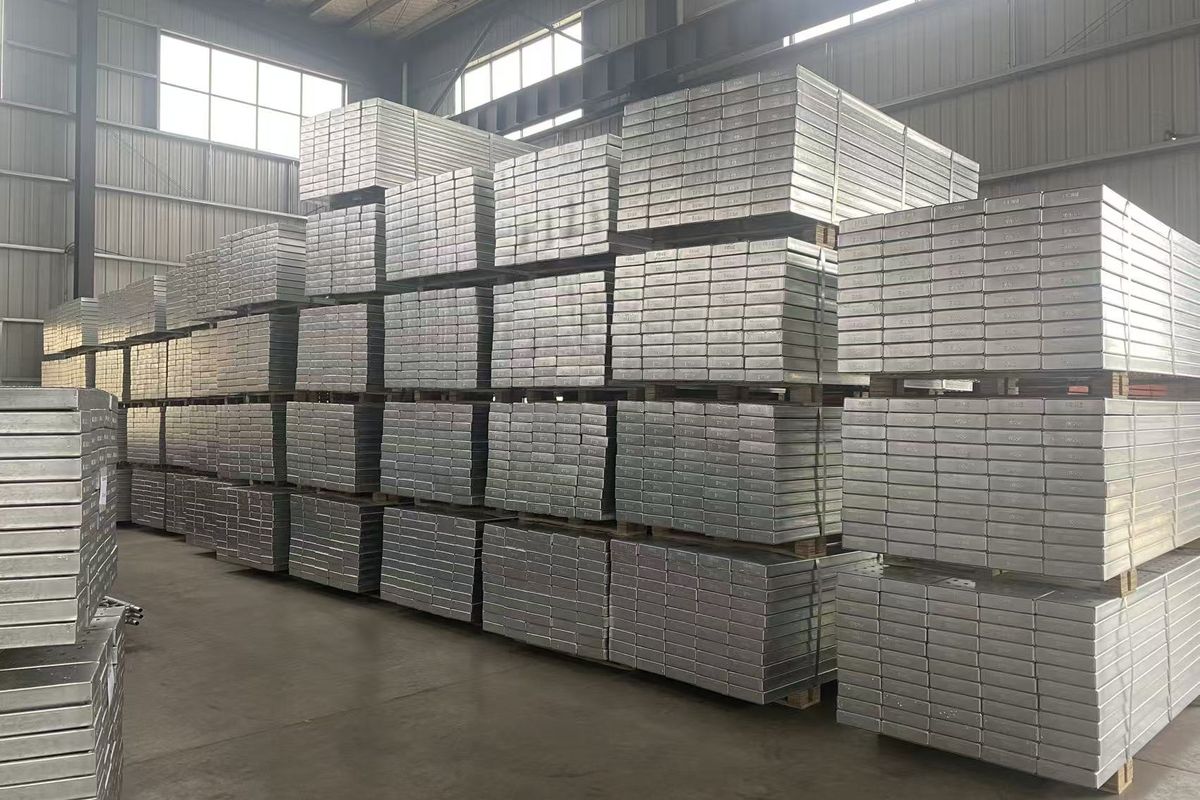
- Damage concentration. Loss is not uniform: planks take the abuse, which is why their weight, profile and coating matter more than their unit price — see the steel plank reference.
- Capital structure. The model charges a flat 8%; leasing, local credit terms and currency movement on a USD-denominated capex all bend it.
- Everything above the cost line. No profit, no tax, no bad debt. This is a cost floor, not a business plan.
One of these deserves a photograph rather than a bullet. Planks move more often than any other component, take the point loads, and are the first thing to go missing on a busy site — the stock below is what the 2.5% loss line actually looks like, and the reason plank profile and coating matter more than plank price.
For Contractors: The Buy-vs-Hire Cross-Check
The same model answers the contractor's version of the question. Put a number on utilised months per year — the months your own sites actually need the grid — and compare:
- Buy: ownership cost per m²-year (from the table above) ÷ 12, plus your storage and handling.
- Hire-in: the local rate per m² per month, times the same months, plus delivery charges on every mobilisation.
The rule of thumb that falls out: buy when the equipment works more than about four months per year, every year, over a multi-year horizon — hire when the work is sporadic or single-project. Cross-border ownership adds a twist: import duty, return freight and resale friction at end of project, which is why bought-in-country fleets outperform shipped-and-returned ones on paper more often than in practice. A container of fleet is a capital shipment, and the return leg is where the shipped-and-returned plan quietly loses its case.
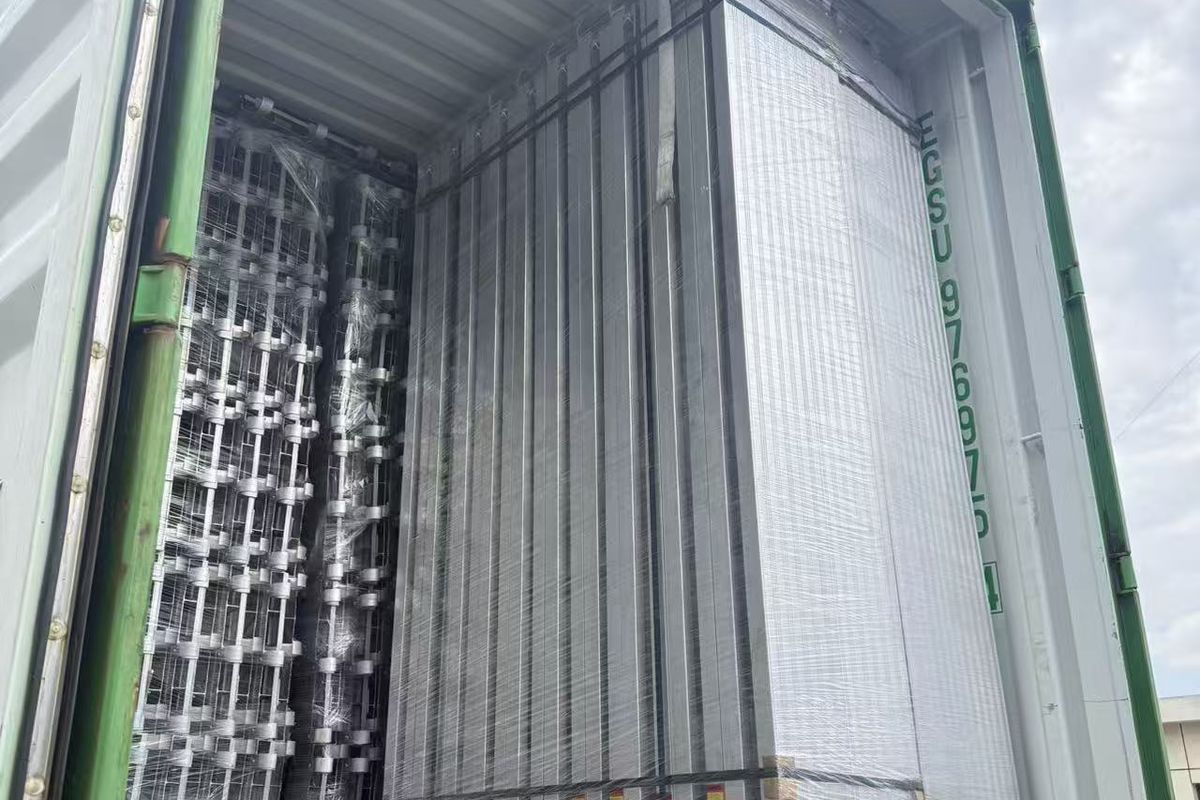
If you do buy, the component list, weights and Incoterms in our quotation guide are the lines that decide whether the asset you bought is the asset that arrived.
Where to Take It From Here
Send us your facade dimensions, your market and your intended utilisation, and we will produce the take-off — component list, tonnage and container plan — that the model's denominator needs. The fleet decision stays yours; the arithmetic should not be the hard part. Start with an enquiry, or browse the ringlock system page for the component specs the model assumes.
Frequently Asked Questions
How do you calculate scaffolding cost per square metre per year?
Divide the annual ownership cost of one tonne of fleet by the square metres it builds times utilisation. With illustrative inputs — USD 1,200/t capex, 8-year life, 65% utilisation — annual ownership is about USD 327 per tonne, the tonne builds 50 m², so the cost is 327 ÷ (50 × 0.65) ≈ USD 10 per m² per year, or about 0.84 per m² per month.
What utilisation rate should I plan for a scaffolding rental fleet?
Established fleets in steady markets run 60–75% of the year on hire; new fleets typically start lower while the customer base builds. The model's break-even sits near 36% at a 1.50/m²/month hire rate — below that, the fleet loses money however well you operate it.
How many years does a ringlock fleet last?
The zinc decides, not the steel. With EN ISO 1461 hot-dip galvanizing (70 µm mean on 3.2 mm tube), 8–12 years of economic life is a realistic planning basis in temperate service; coastal or industrial atmospheres shorten it. Life is the single most powerful lever in the TCO model.
Is it cheaper to buy or rent scaffolding?
It is a utilisation question. As a rule of thumb, buying wins when the equipment works more than about four months per year over a multi-year horizon; hiring wins for sporadic or single-project use, especially across borders where return freight doubles the haul. Run both numbers per m² per year before deciding.
What is the biggest hidden cost in a scaffolding fleet?
Loss, damage and shrinkage, typically 2–3% of fleet value per year, with steel planks the most-damaged item — plus transport, which recurs with every hire cycle. Both are operating costs a purchase price never shows, and both respond to yard discipline more than to component price.